Saturday, 30 December 2023

Validating my Power Delivery Optimiser: Steps 1 & 2

Steps 1 & 2: Gathering data and rider parameters for the constant power case.  

The introduction post written previously (here) explains the objective and context of this Step 1 & 2 of the study.

Route Selection

Firstly, I needed to decide a suitable route.  Strange as it may seem, I didn't want to use an outdoor route.  The difficulty of doing a test like this outdoors is that the conditions are so variable. The wind changes, traffic interferes with aerodynamic drag and gets in the way, road junctions have to be avoided, etc.  Then I would also have to ensure my bike, my power meter and my body position stayed consistent between runs.  

I really wanted to avoid those constraints and difficulties associated with doing the test outdoors, so I instead decided to use a virtual route on Zwift.  This is also not ideal, because the bike speed in Zwift is calculated with a computational model, so I'll effectively be using a model (Zwift) to validate another model.  However, I feel that the benefits of having a fully controlled environment to test the power delivery optimiser outweighed the doubts and downsides that may come from using Zwift.

For the route, I decided to use the Whole Lotta Lava route.  I picked this route because it was reasonably short at 12.3km (7.6 miles), so it would take less than half an hour to ride.  Also, it includes a good mix of terrain, with a flat section, a climb and a descent in approximately equal amounts, as shown in the route profile to the left.  The amount of climbing, with 160m (525ft) climbed in 12.3km is the kind of elevation change that I typically see in my local rides and the terrain in the South West of England where I live.

Finally, the route is almost entirely pavement, which makes the treatment of rolling resistance somewhat easier.  There is a short section of wooden boardwalk, perhaps 200m in length that has to be crossed on climb and the descent, but I'm hoping that is not significant enough to complicate the modelling.

Bike Choice

For this type of test, a TT bike is the best bike to use, because Zwift does not allow a TT bike to gain a benefit from drafting other riders, unlike for their road bikes.  This means that any ride I would do on a TT bike, and the associated segment time for the Whole Lotta Lava route, would not be affected by the presence of other riders.

In Zwift I have the Canyon Speedmax TT bike with Zipp 808/Super 9 wheelset.


Riding the route at constant power

I decided to perform the constant power reference case at a fixed power of 150 Watts.  This is approximately 60% of my FTP, so it makes it a comfortable long-slow-ride kind of pace.

I ensured that that my ride was done at exactly 150W by using TrainerRoad in ERG mode to control my Wahoo Kickr trainer, ensuring that I held a power of exactly 150W, then linking the Kickr trainer to Zwift via it's second bluetooth connection so that the Zwift ride was done at 150W.  It can be seen in my Strava activity file (screenshot shown above, link to Strava activity here) that the power trace is constantly at 150W.

The entire Whole Lotta Lava route was done first, then I also performed most of a second lap too.  The second lap was useful because the translucent pace partner (which follows the pace of my best time) was a demonstration that Zwift was reproducing the pace almost exactly, as shown in the screenshot to the left.  This was the top of the climb, approximately half way through the route.  Note that the pace partner (riding at the pace of my previous lap) is very close to my avatar on the second lap.

This is to be expected, of course, but it was reassuring to see.  This is the kind of repeatability that would be impossible if riding a route outside!


Reference parameters

For the subsequent power delivery optimisation, I will also have to decide values to use for the following parameters:

  • Total weight (rider + bike)
  • CdA (drag coefficient x frontal area)
  • Crr (coefficient of rolling resistance)
  • Air pressure
  • Air temperature (which together with air pressure, gives the air density)
  • Drivetrain losses, if indeed Zwift even account for these.
The choice of these values should match as closely as possible as what Zwift models, some of which it's possible to determine, but some of which are unknown.

Weight
I entered my weight of 73kg and my height of 5'10" into Zwift.  I'm not sure what weight Zwift assumes for the bike, so this is something I had to figure out as part of the virtual elevation (VE) analysis.

Coefficient of rolling resistance (Crr)
According to Zwift Insider, Zwift assumes a Crr value of 0.004 for road and TT bikes on pavement.  I will use this 0.004 value for the VE analysis.  The small section of wooden boardwalk apparently pushes the Crr up to 0.0065 for that short period of time.

Drag coefficient (CdA)
Previously, when I unlocked the Zipp Super 9 disc wheel, I calculated (here) that the CdA was 0.2415 m^2.  I will use that value for VE analysis.

Air Pressure and Temperature
As I did previously, I assumed International Standard Atmospheric Sea Level conditions (101250 Pa, 15 degrees Celsius), which results in an air density of 1.225 kg/m3.  It's worth noting that pressure, temperature and the resulting air density only affects aerodynamic drag and nothing else.  Therefore, if the assumption is wrong, it will simply bias the CdA value which is also chosen, because it's the product of CdA and air density that affects aerodynamic drag.  As the CdA is obtained from the VE analysis, the choice of pressure, temperature and air density is rather arbitrary and intrinsically linked to the CdA value selection.

Drivetrain losses
I used a value of 2.5% as starting point, to be checked with the VE analysis.


Virtual Elevation Analysis

I used the .fit file from my Zwift ride to perform a virtual elevation analysis using Golden Cheetah's Aerolab Chung Analysis feature. The plot to the left shows the final fit between the real elevation curve (from Zwift, in green) and the Chung Method virtual elevation curve (in blue).  As can be seen in the plot, keeping the values above and changing only the total weight to 80kg gives an excellent fit between the blue and green curves, to the point where it's almost impossible to see the two different elevation profiles.  I also tried using other combinations of parameter values, but using this combination of parameter values gave the best match.


Summary and Results

My constant 150W ride took 27 minutes and 15 seconds to complete the Whole Lotta Lava route, which equates to an average speed of 16.8mph (27.0 kph).

My virtual analysis showed that the values used by Zwift which I need to use later for the power delivery optimisation are:

  • Total weight (rider + bike) = 80kg
  • CdA (drag coefficient x Frontal area) = 0.2415
  • Crr (coefficient of rolling resistance) = 0.004
  • Air pressure = 101,250 Pa
  • Air temperature = 15 degrees C
  • Air density = 1.225 kg/m^3
  • Drivetrain losses = 2.5%
I'll publish the next blog post to describe the improvements to my power delivery optimiser, once I've done that.


Friday, 29 December 2023

Validating My Power Delivery Optimiser: Introduction

In one of my earliest blog posts (here) from 2015, I described the power delivery optimiser that I created using Microsoft Excel.

I also used it to help a friend try to improve his personal best time for his favourite bike route (here). In doing so, I showed that my power delivery optimiser gave a similar optimal power profile to the profile that BestBikeSplit gave.

However, I have never properly validated my optimiser, or BestBikeSplit either, to prove that following those power targets does indeed give an improvement in performance.  It should do of course, because there is no reason why the modelling should have deficiencies.  Nevertheless, it would be satisfying to validate it properly, and this is what I intend to do in the coming weeks.

I have several steps in mind, because I also intend to improve my Excel-based power delivery optimiser so that it's generally easier to use.  This blog post is the first step, where I'll outline what I intend to do.  I'll then write additional blog posts as I make progress, and will update this post to include the relevant links.

The summary below describes briefly what I'll do and includes links to the more recent blog posts that will describe in more details the studies and the results.

Summary and links

  • Step 1:  Gathering data for the reference case (constant power).
  • Step 2:  Determine rider/bike parameters (CdA, Crr, weight).
  • Step 3:  Use BestBikeSplit to create an optimum power delivery profile.
  • [To be done] Step 4: Calculating the optimum power delivery profile using my optimiser.
  • [To be done] Step 5: Improve my power delivery optimiser.
  • [To be done] Step 6:  Calculate the optimum power profile for the route cycled in Step 1.  Do the same for BestBikeSpilt and compare.
  • [To be done] Step 7:  Re-ride the route following the optimum power profile, to see whether it improve the average speed versus the constant power approach done in Step 1.


Thursday, 28 December 2023

Repeating the Thunder Burt vs Race King CRR test

Race King versus Thunder Burt
Yesterday (27th Dec '23) I repeated the rolling resistance test that I did last year, in which I compared two of the fastest mountain bike tyres that are available: The Schwalbe Thunder Burt Super Race tyre and the Continental Race King Protection.

Why repeat?

A couple of things have changed since I did that previous test in February 2022, which I think will improve the quality of my testing.


Firstly, last year I bought a Power2max spider-based power meter for my MTB.  A spider-based power meter has the benefit over my single-sided Stages power meter that I used last year because it measures total power.  Any single-sided power meter assumes that the total power is double the power that is measured on the left hand side, so has some inherent uncertainties coming from that assumption.

Secondly, I now have a second pair of wheels for my MTB.  This enables me to mount a 2nd tyre on the other rear wheel and perform a back-to-back test with less effort to swap the tyres over, and less delay between tests.


Testing protocol

I performed the testing in exactly the same manner as I did previously.  The process is briefly summarised below:

1)  Mount tyre/wheel on bike.  Measure how much weight is on the back wheel when I'm sitting on the bike (which in this case, was 54.9 kg).

2)  Warm up the tyre for five minutes at 80-85 rpm and ~150W / 24mph.

3)  Adjust tyre pressure (takes ~1-2 mins) to the desired value.  During this time, the Power2Max power meter will automatically calibrate its zero offset value.

4)  Pedal for 4 minutes in same gear, at a similar 80-85 rpm.  For the final 2 minutes, measure the average power and speed.

5) Results were recorded in the spreadsheet and the CRR was calculated using the standard Tom Anhalt method

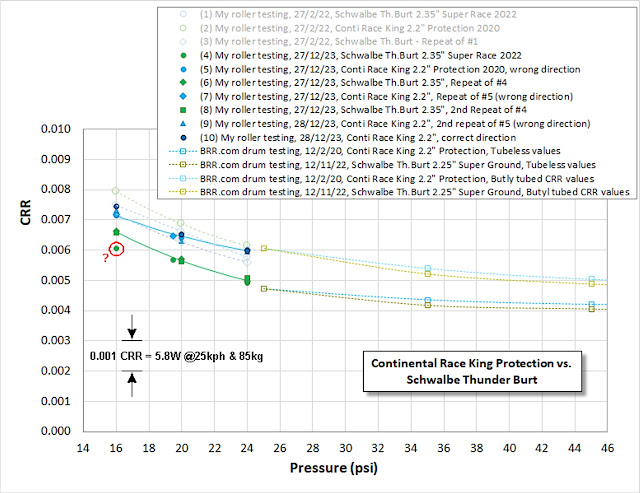
For this test, I performed an ABABA style test (A=Thunder Burt, B=Race King), so with two repeats for the Thunder Burts and 1 repeat for the Race Kings.  The reason for repeating the Thunder Burt a second time was because I got a strange results for the first test at 16 psi.


Results and observations

As shown in the CRR plot below, the Thunder Burt is clearly the faster tyre of the two. During test, the power needed to keep the rear wheel spinning at ~23mph was noticeably higher by 15-20 Watts for the Race King.  The results from my 2022 test are shown in grey in the plot, for reference.  Note that those 2022 tests were performed with a butyl inner tube, instead of tubeless.  This difference, together with the single-sided power meter, might account for the difference in results.

Note also that the Bicycle Rolling Resistance test results in the plot below have been updated to show the tubeless BRR results instead.  In previous years, all of the BRR testing was performed with a butyl inner tube. It's only recently in 2023 that BRR changed it's protocol and updated their results to show data for a tubeless setup whenever appropriate.

What's also noticeable in the plot above is that the results are incredibly consistent and repeatable, which I am really pleased with.  This is probably due to my new power meter which avoids errors coming from inconsistent left/right leg balance.  

There is one outlier though, one of the low pressure results for the Thunder Burt (denoted by the red circle in the plot above).  As this is a clear anomaly in the otherwise consistent data, I ignored it when of creating the green Thunder Burt trendline.

What I'm not so pleased about though (and this is a massive "DOH!"), is that I have just realised that I mounted the Race King in the wrong direction.  This is really annoying and it might be the reason why the Race King has higher CRR values than the Thunder Burt and why the differences seem to be larger than I measured previously.

I need to think what to do next.  At the moment, I am not inclined to repeat the whole test!

Addendum 28/12/23 - Correcting my mistakes

I really couldn't leave this test as it was, with Race King results for the tyre mounted in the wrong orientation.  On the following day (28th Dec '23), I decided to repeat the Race King test with the tyre mounted the correct way round.

Before re-mounting the tyre, I first performed a repeat test with the tyre exactly as it was the previous day (i.e. the wrong way round), to ensure I could get get consistent results with the previous day.  The results from this repeat test are shown with the light blue triangles in the plot below.  It's pleasing to see that the repeatability of the test results with the previous day's testing is very good, so on this basis, I didn't feel that it was necessary to repeat any of the Thunder Burt tests too.

I then removed the tyre, flipped it around and remounted it so that it was now rotating in the correct direction.  The new results for the Race King tyre mounted in the correct direction are shown with dark blue circular symbols in the plot below:

Race King versus Thunder Burt

It's interesting to see that when the Race King was mounted in the correct direction, the rolling resistance seems to be similar.  In fact, if anything the CRR values are slightly higher than when it was mounted backwards, which was a little surprising. The differences are very small though, and are the same order of magnitude as the repeatability.


Conclusion

After this additional testing, I think it's safe the conclude that the 2.35" Schwalbe Thunder Burt Super Race is a faster tyre than the 2.2" Continental Race King Protection.  The differences seem to be ~4-6 Watts of rolling resistance for a 85kg rider+bike cycling at 25kph (~15.5mph), depending on the tyre pressure.

It's worth noting that the 2.2" Race King measured slightly narrower by 0.11 inches (=2.8mm or 4.7%), which would penalise the rolling resistance for Race King relative to the wider 2.35" Thunder Burt at a given pressure.  The effect of the width difference should be quite small though I think, based of tyre width effects I've seen on BRR.com, like this test for example.

As with all roller or drum testing, it is worth remembering that testing of this nature only detects the tyre hysteresis effects of the tyres.  These tests cannot capture the other losses associated with riding off-road, such as the so-called suspension losses that that are created from the rider 'jiggling around', or the hysteresis losses that occur in the ground itself.  So for example, the CRR relationship versus tyre pressure seen in roller testing or drum testing goes in the opposite direction to what the tyre pressure effects I have seen when doing proper off-road tyre testing (see here, for example).

Nevertheless, I believe that the relative tyre hysteresis losses that are captured by roller testing of this nature are still relevant to off-road riding, and will be one element of the total rolling resistance that remains present when riding off-road.  Therefore I think this result and results from tests like it (on BRR.com for example) will still show which tyre is relatively faster.


Thursday, 21 December 2023

The Drop Bar MTB - Is it faster for Cyclocross?

In my previous blog post, I described the drop bar conversion that I did for my hardtail MTB.  I did that conversion in an attempt to create a bike that's as fast as possible for 'light' off-road duties - faster than a hardtail MTB and faster than a traditional gravel or cyclocross bike.

Based on the testing that I've done in recent years, this drop bar MTB bike should be faster on a grass surface like a cyclocross (CX) course than my CX bikesomewhat counter-intuitively.

During the latest 2023 CX season I therefore decided to use my drop bar MTB for any CX races that were dry enough to be suitable for the semi-slick Schwalbe Thunder Burt tyres.  For the muddy races, I used my CX bike with mud tyres, knowing that the grip from the Thunder Burt tyres would be terrible in mud.  It's worth mentioning that my local Cyclocross League doesn't apply the UCI rule of 33mm maximum tyre width, and doesn't have other bike restrictions, so anything is allowed.  MTBs are often used by people that don't have CX bikes.  Given the lack of restrictions around bikes, my general approach is to use the fastest bike possible, rather than sticking with tradition.

The question is, was the drop bar MTB actually faster or not?


How I judged the bike performance

I did seven CX races this season, from September through to early December.  The last one I did was a regional race, with riders entering from two Leagues (Western League & Wessex League), so that 7th race was much more competitive than the other six races, so my result was worse than the others.

For the first six Western League races, I felt that my fitness was broadly similar, and therefore my results in those six races, and my speed relative to my competitors, would provide a good indication whether or not the drop bar MTB was faster than the CX bike.

It has been a very wet autumn here in the South West of England, so unfortunately there weren't many dry races this year. 
 Of the six races, only two races were dry enough to use the drop bar MTB.  Even for those two, the courses were still muddy in places.  So for two of the races, I used the drop bar MTB, and for the other four races I used my CX bike with 33mm Challenge Handmade Tubeless Ready Clincher mud tyres, with the tyre model choice based on the level of muddiness (either Baby Limus or Limus).

I analysed my performance relative to my competitors in two ways:

1) What my finishing position was relative to the size of the field, calculated as a percentile.  For example, if I finished 20th out of a field of 50 people starting the race, that's a 40th percentile finishing position.

2) Secondly, what my finishing time was relative to the winner.  For example, if the winner finished in 1 hour and I finished in 1 hr 6 minutes, my 6 additional minutes make me 10% slower than the winner's time of speed.

Of these two methods, I think the first one is a slightly more reliable method, because the second method is influenced by a single person; the winner's performance. It therefore depends on whether the fastest rider in the region raced in a particular weekend and how he performed in that race.

It's worth noting that although I changed bike and tyre width for each race depending on the conditions, almost everybody else in the field, especially the top riders, used the same cyclocross bike with 33mm tyres for all their races. 


Results

The plot below shows the results using these two methods.  Regardless of the method, it's clear that I achieved better race results using the drop bar MTB than my CX bike.  Like many things, this is not 100% conclusive, but I still think it's a strong indication that the drop bar bike is faster.

Drop bar MTB versus Cyclocross bike


Sunday, 17 December 2023

Mountain bike drop bar conversion


This is the drop bar conversion that I've done for my Scott Scale hardtail mountain bike.

This post describes why I did this conversion, what I components I used, and how much it cost me.


Why?

I admit it's a strange-looking bike, and unusual build; a MTB with a drop bar.  It may not be obvious why anybody would want to swap out the flat MTB handlebar for a drop bar.  There are three mains reasons why I did this conversion, which I've explained below:

1)  Wider tyres are faster off-road.
Firstly, over the last few years I've down a lot of testing that has consistently shown that wider MTB tyres are faster than narrower gravel/cyclocross tyres.  Those tests are summarised briefly below, with links to my previous blog posts that describe the tests in more detail:
  • In 2021, I did a back-to-back test around the same road loop, riding my road bike, then my gravel/cyclocross bike, then my hardtail MTB.  The really surprising result from that test was that MTB was actually no slower than my gravel/cyclocross bike.  For both of those bikes, the tyres were reasonably fast tyres in their own category, both scoring quite high on the individual tables of Bicycle Rolling Resistance's gravel and MTB tables.  Because the test was done on a road circuit, you'd think that would favour the gravel bike versus the MTB.  However, the results indicate that the improved rolling resistance of the MTB tyres versus the gravel tyres was cancelling out the less favourable aerodynamics of the MTB (due to wider tyres, the flat bar, the suspension fork etc).
  • Then, in 2022, I performed a virtual elevation test (a 'Chung method' test) for my MTB around a grass field, to determine the optimum off-road tyre pressure.  An interesting observation from that test was how much faster the 2.35" Schwalbe Thunder Burt tyres were than the 35mm Schwalbe X-one cyclocross tyres that I tested back in 2020.  The rolling resistance coefficient difference between them was enormous, equivalent to 30-35W at 15mph. 

  • Then, later in 2022, I performed a similar virtual elevation grass test using my cyclocross/gravel bike which this time was fitted with 40mm Continental Terra Speed gravel tyres.  The aim was to determine whether the CX/gravel bike was quicker overall than my MTB with it's Thunder Burt tyres, to help me decide which bike to use for an upcoming cyclocross race.  Surprisingly the MTB was faster, despite the worse aerodynamics.  This again indicated that the lower rolling resistance of the MTB tyres was outweighing it's aerodynamic disadvantages, to give a net speed benefit.
All of this showed that wider tyres, especially the Schwalbe Thunder Burts that I had tested for two of those tests, were much faster than narrower gravel and cyclocross tyres, even faster than very good tyres like Conti Terra Speeds. 

That got me thinking, whether the best combination for a fast and light off-road bike would be the wide Schwalbe Thunder Burts coupled with a more aerodynamic bike and riding position.


2)  MTB tyres don't fit into the frame of my cyclocross/gravel bike

Sadly the frame clearances of my Planet X Pickenflick cyclocross/gravel bike does not allow me to fit my Schwalbe Thunder Burts.  Even if I bought the 2.1" version instead of the 2.35" size, they wouldn't fit.  The maximum tyre size for the frame is about 50mm, which is fairly large by cyclocross bike standards, but is not big enough for MTB tyres.

Hence, getting fast MTB tyres onto my cyclocross/gravel bike was unfortunately not an option for me.

Interestingly, around this time, I saw a Twitter post from Tom Anhalt who also said that his favourite gravel tyre is actually a MTB tyre.  He commented that he was looking to convert his gravel bike to take 650B wheels.  I didn't fancy going in that direction though, because it would require new 650B wheels etc.


3) My new full-suspension MTB
The third and final reason that persuaded me to convert my hardtail MTB to a drop bar bike was getting a new full-suspension XC MTB in early 2023.  Until then, I had ridden my Scott Scale hardtail MTB as my 'best' MTB for any fast MTB rides.  However, having bought a nice new full suspension MTB in the spring of 2023, a Specialized Epic Evo, I found that I was then rarely using my Scott Scale.

My Scott Scale hardtail seemed somewhat redundant in my garage, in the presence of the full-suspension XC bike and my gravel/cyclocross bike.  There were few types of rides and terrain where it was a better option than those other two bikes.

It was these three things that persuaded me to convert my Scott Scale MTB to a drop bar bike.  I also had a spare pair of SRAM Rival 1x hydraulic shifters, which I could re-use for my my bike build, helping to reduce the cost of the conversion. 


Components and cost

I had to buy the following items for this build:
  • Ribble Level 3 Carbon Aero Road Bar:    £39.00   [RRP £149.99, no longer available]
  • SRAM Rival 1 Long Cage Rear Mech:    £34.00   [RRP £124.00]
  • 2 x SRAM road hydraulic disc replacement brake hoses:  £75.19   [RRP £92.00]
  • Schwalbe Thunder Burt Super Race 2.25" front tyre:   £52.79   [RRP £68.99]
  • Planet X Selcof Carbon Rigid Fork:   £99.99   [RRP £199.99]
  • Syncros semi-integrated tapered headset:   £15.99   [RRP £45.99]
  • 100mm -> 110mm boost axle adapter spacers:   £7.85   [RRP £8.33
  • Lifeline professional bar tape:   £11.43   [RRP £12.99, no longer available]

I already had the following items spare, so these didn't cost me anything at the time of this build:
  • SRAM Rival 22 11- Speed Shift Brake Lever Set    Already owned   [RRP £532.00]
  • Ritchey Comp 4-Axis 30 degree 60mm Stem:    Already owned   [RRP £42.99]

Note that I only had to buy the front tyre because I wanted to move my old 2.35" Thunder Burt front tyre onto my new full-suss MTB as a rear summer tyre, and 2.35" Thunder Burts were out of stock everywhere.  Hence I had to get a 2.25" version instead.

The total cost to me for the items above was £336.  As shown above, some of the items I managed to get were real bargains, bought at a significant reduction compared to their recommended retail price (RRP).  The total RRP of all the items I had to buy is £702.   If I had to also include the cost of the shifters and stem, which I had already as spare items, the total RRP cost would be £1277.

In summary, at just over £300, I think this was a fairly cheap conversion.    However, if I had to buy all of the items at full price, the £1200+ cost would have been significantly higher.

The Outcome

I'm really pleased with the way the bike has turned out.  Not only was it a fairly cheap conversion to do, but the bike feels great when riding off-road trails.  It feels faster, more forgiving and more comfortable than my cyclocross bike with 40mm gravel tyres, but also faster than my old hardtail on road sections and whenever the off-road speeds are higher.  I feel that for the majority of off-roading riding I do, it's the ideal of bike to be on.

Looks wise, I have to admit that it's a bit ugly and unusual looking, but I'm okay with that.  The weight of the bike is 8.67 kg (19.10 lb), including pedals, bottle cage and out front Garmin mount.

I have used the bike for a few cyclocross races in recent months, and it has performed well, helping me to get better race results than normal.  In a future blog post I'll show more details about these Cyclocross race results.

It's interesting that in 2023, the racer Dylan Johnson has also started to use a drop bar mountain bike for his gravel/MTB Life Time Grand prix Races in the US.  In a recent YouTube video he explains his reasons for using a drop bar MTB this bike and tyre choice, which are similar to mine (although Dylan favours Conti Race Kings instead of Schwalbe Thunder Burts).