For some time now I've wanted to determine what the optimal tyre pressure would be for off-road conditions, in terms of rolling resistance.
One of my favourite series of races is my local summer cyclocross series, organised by the British Western Cyclocross League. The races are convenient for me, held on weekday evenings during the summer and they are local too, meaning I can ride to and from most races.
These summer cyclocross races use courses similar to most winter CX courses, so a combination of grass and dirt. With the dry conditions of summer though, the grass stays as grass and it never gets too muddy. For the majority of the time, then, we're riding on grassy surface with a fairly hard underlying dirt surface.
It's always been difficult for me to judge what the optimum tyre pressure is for these conditions. The conventional wisdom amongst cyclocross racers is to use the lowest possible pressure. However, I'm not sure how much this common practice is dictated by traction considerations. What's the optimal pressure for rolling resistance in off-road grassy conditions, bearing in mind that traction is rarely a problem in the summer? This is what I wanted to determine.
Methods Available
In a previous post, I briefly talked about the Virtual Elevation (VE) method, which is also called the Chung Method, invented by Robert Chung. This VE method can used to evaluate the CdA, or drag area, of a bike and rider. The method can also be used to evaluate rolling resistance changes, although this in much less common. VE testing is general performed by time trialists and triathletes wanting to improve their aerodynamic drag, which is by far the dominant resistive force for these disciplines. There have been some VE rolling resistance studies done though, for example T.Maier et al.
The methods that are generally preferred for evaluating bike tyre rolling resistance characteristics are drum testing (BicycleRollingResistance.com example here) or roller testing (Tom Anhalt example here). However, drum testing and roller testing only determine the losses due to deformation hysteresis in the tyre itself, i.e. the energy losses in the rubber when the tyre squishes at the contact patch and rebounds. It is well known that when riding outdoors, there are also losses that can occur in the bike/rider system as a consequence of the bumps being transferred to the rider. These additional losses are often called 'suspension losses' (a more detailed explanation can be found in this article). These suspension losses through the tyre to the rider are greater at higher tyre pressures, when the tyres are harder, which is the opposite of the pressure trend for tyre hysteretic losses. As a consequence, unless the road is perfectly smooth (which is only true in an indoor velodrome), the combination of suspension losses and tyre hysteretic losses means that there is usually an optimum tyre pressure that gives a minimum coefficient of rolling resistance (see plot below).
For off-road riding, such as cyclocross, gravel or mountain biking, it's important to evaluate the effect of these suspension losses, since the ground can be quite bumpy. Unfortunately, drum or roller testing would only give part of the picture, the tyre hysteretic loss part. As a result, for my objective to determine the optimum pressure for summer cyclocross races, I chose to use the Virtual Elevation (VE) method.
Method details
Bike
I performed the testing using my cyclocross bike, a Planet X Pickenflick bike, which is fitted with 35mm Schwalbe X-One Allround tubeless clincher tyres.
For this testing, I fitted the bike with my 105 chainset and LH Stages power meter from my road bike, since power meter measurements are needed to perform VE testing.
Road VE testing and venue
I firstly performed a VE test on a local 1 mile road circuit, for the purposes of determining my CdA.
I would later maintain the same hoods position on the bike during the subsequent off-road testing and therefore assumed that my CdA remained unchanged for the calculation of off-road rolling resistance coefficients.
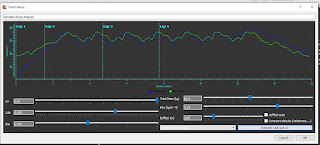
For this road testing, I imported the data into Golden Cheetah to perform the VE analysis. I concluded that my CdA was 0.393 m^2 and my rolling resistance coefficient (CRR) on tarmac at 45 psi was 0.0100.
Off-road VE testing and venue
I then rode about a mile to the south, to a grassy field near my house, to perform the off-road testing.
Testing Protocol
My testing protocol is described in full below. This can also be found in a post and subsequent discussion on the Slowtwitch Platypus Thread, on Page 20, which is a forum page dedicated to discussing the Virtual Elevation testing amongst cycling enthusiasts.
- Stages 2nd generation left hand crank-based power meter. This is not ideal, to use a single-sided power meter, but it's all I've got.
- Tyre pressures measured with a digital Topeak pressure gauge. Possibly not accurate, but hopefully consistent.
- Garmin speed sensor. I used a constant value for the circumference in my Garmin head unit throughout the test, but then post-processed the results later to adjust the speeds based on the different measurements of when diameter for the different tyre pressures.
- Air density: Pressure from the weather forecast app. Temperature from the Garmin head unit.
- 0.97 transmission efficiency assumed throughout.
- Bike + rider weighing before and after the ride.
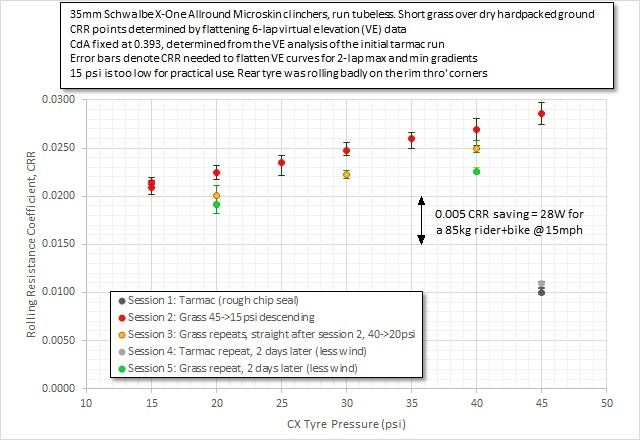
- No adjustment for wind. Sessions 1-3 in the chart were done with the forecast wind being 10-15mph. From what I've read, the ground level wind speed is less than the forecast wind speed by about half. My hope is that it would be consistent enough to give good enough increments between the pressures, even if the absolute numbers might be affected by the wind.
Tarmac runs
1) Tyres inflated to 45 psi.
2) 6 x laps of a tarmac oval loop, each lap 1 mile in length. First 3 laps done at ~230W, next 3 laps done at ~130W. No traffic.
3) VE analysis done in Golden Cheetah and Excel to check they give the same result, to check I haven't made a mistake in my Excel equations.
4) CdA and CRR determined post-ride so there is no elevation loss or gain over the six laps, trying also to keep the same flatness for the sets of fast and slow laps. The CdA derived from this analysis, 0.393, was then used for the VE analysis for the grass runs.
Grass runs
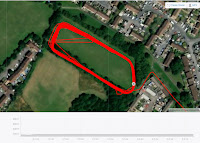
Straight from the tarmac runs, I cycled about 1 mile to a local grass field, roughly the size of a football pitch.
1) I checked the pressure before starting at 45 psi.
2) Accelerated up to speed before the maximum elevation point of the lap. Pressed the start/stop on the Garmin about 5-10 seconds before the max elevation point.
3) 3 laps at ~230W, followed by 3 laps at ~130W. I changed gear only once at the transition between fast and slow sets of laps, to keep the cadence reasonable. The time to do six laps was 7-8 minutes. I tried to follow a consistent line, but I had to avoid an occasional dog walker, approximately once every 5 laps (and these days trying to give people at least 5 metres of space!)
4) After the max elevation point at the end of the 6th lap, I continued for ~10 seconds, and pressed start stop on the Garmin.
5) Stopped in the shade. I avoided direct sunlight when stopped to prevent the sun warming the tyres. I checked the pressures, before then reducing the pressure by 5psi ready for the next run. I could get it within 0.5psi of the target. If I overshot the reduction for the first tyre (e.g. 39.5psi), I compensated by leaving the other tyre half a psi higher (e.g. 40.5psi). I chose to reduce pressure, rather than increase it, because I was concerned that pumping the tyre up might increase the internal air temperature and possibly the tyre wall temperature. Letting pressure out was also easier.
6) Step 2 onwards was repeated for 45 psi down to 15 psi in steps of 5 psi.
7) I then went home (<1 mile away), pumped the tyres back to 40 psi with a track pump, returned and followed the same protocol, but in 10 psi steps (40, 30, 20 psi). I wanted to do these repeats because I hadn't done an ABAB type test, and also because the grass was becoming increasingly flattened, which I think might have affected the CRR.
8) I also did a few repeats two days later, on a less windy day (~5mph wind according to the forecast)
9) CRR values were obtained to give no elevation gain/loss over the 6 laps, using the fixed CdA of 0.393. I obviously tried to keep the same kit and position on the bike throughout.
Results and discussion
I had a short discussion about these results with some of the experts on the SlowTwitch forum. Tom Anhalt made an interesting comment that studies done for the Swiss MTB team a few years ago concluded the same way, that lower pressure is best. He also said that the deformation of the surface (the ground, grass and dirt in this case) may be a large contributing factor, which in contrast is a negligible effect for the road. This was a really interesting insight, and made me realise that for off-road riding, in addition to tyre hysteretic losses and suspension losses, there is a third source of rolling resistance, and that's hysteretic losses in the ground. For anybody that has even tried cycling on sand, you'll be very aware that these hysteretic losses in the ground can be rather large!
Conclusion
The results showed me that I need to run my tyre pressures as low as possible. The limit, to how low I could go, is however governed by a couple of factors:
- Tyre Stability: I found that below 20psi the tyre rolled around badly on the rim when cornering. In these situations, a tubeless tyre can also 'burp' air, which can end a race if it happens a few times.
- Pinch flats: Even running tubeless, running very low pressures means that hitting rocks and hard obstacles can cause pinch flats in the tyre casing that won't seal.


0 comments:
Post a Comment